

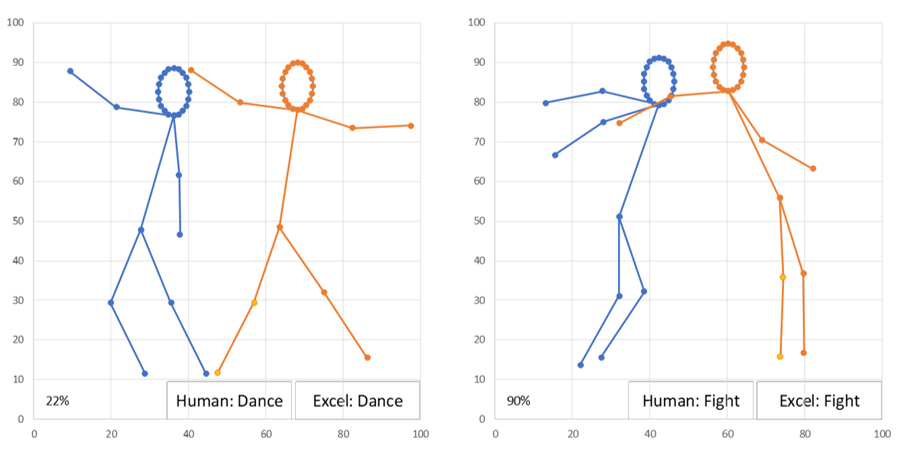
A Neural Network in Excel learning the difference between fighting and dancing.
I’ve been building Neural Networks in Excel for a few months and have been looking for a data set that would capture something too hard for humans to explain but easy for us to identify. Basically, a classification that we can recognize instantly but can’t easily explain. I also wanted as few dimensions in the data as possible to keep the Excel light. The slightly silly problem that I came up with was our ability to see a relationship between two randomly generated stick figures placed side by side. There are plenty of interpretations we can put on their relationship but the classes I came up with were fighting or dancing. For Example:
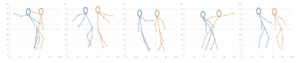
I think these are Dancing:
I think these are Fighting:
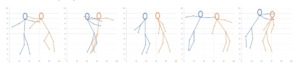
The plots are interesting because there are many different ways that people dance or fight and our brains can usually see these, but can you describe the general difference.
I thought no but given the unreasonable effectiveness of neural networks to recognize patterns, maybe they could figure out what that difference was.
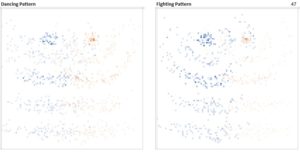
These plots show how the cases differ for those labelled by me as dancing and separately, to the right, as fighting. There really is nothing obvious here.
The spreadsheet generates stick figure couples with 10 dots per figure and I’ve laboriously picked out and labelled 600 cases where they appear to me to be either fighting or dancing. The spreadsheet contains two on-sheet fully connected neural networks with 2 layers of 15 and 10 neurons ending in a sigmoid binary classifier and looking at 24 XY coordinates in a flat 48-dimensional vector (there are 2 repeated dots; the neck and the pelvis – wasteful but I was lazy). The first Neural Net runs 5 batches of 100 cases each and learns the difference between Fighting and Dancing and the second runs stochastic gradient descent on a single case at a time using the learned parameters of the first but looking at a separate test dataset of 100 fresh, unseen labelled cases.
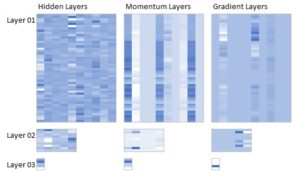
Excel lends itself well to building and understanding Neural Networks because it requires an explicit physical layout for the layers within the model, they are not hidden in virtual arrays defined by for-loops but displayed as actual blocks of numbers. The plot below shows the core of the model’s “brain”, the hidden layers and the parameter weights that, once trained, capture the function that we humans each develope to distinguish between aggression and joy. The Momentum and Gradient layers give you a view of how the spreadsheet learns. The gradients of the function are derived directly from a case (or 100 cases for this vectorized model) run through the current learned parameters. The gradients give the direction of travel required to update the parameters of each layer in order to reduce the loss function i.e. the difference between my classification of a particular case and the spreadsheet’s current understanding. If left to train for an hour or so with a small enough learning rate, the model will learn the training cases to an accuracy of 100%. However, this would be an example of overfitting and would not capture the essence of fighting or dancing and therefore not generalize well to new cases.
Excel has some real advantages for coding neural nets, beyond the fact that for me it’s the tool I know and I’m still Python semi-literate. I think these advantages are as follows:
- They lay the structure bare. All layers, all neurons and all connection weights are exposed, no searching or displaying the results of nested For loops, just 2D blocks of numbers.
- When coding you make fundamental wiring errors: This is not so helpful if you know where you’re going but at this stage, neural networks are still a black art. In all the training I’ve done to date the experts use the phrase “this works well but we don’t know why”.
- It’s slow to train and you see it train in minute step by step detail. This gives you time to think and ponder what’s going on, what’s wrong and what’s just plain peculiar.
If you’re interested in this, please let me know and I would be happy to share more with you. I’d certainly welcome any questions and queries you may have and will be releasing some of the base models on GitHub. Any expressions of interest prior to this would also be welcome.
I’ve uploaded a Youtube Video of the model running here: https://youtu.be/RsQp-5feqZQ and you can see more related Neural Network in Excel stuff on my channel here: https://www.youtube.com/
This videos and associated material if released are available to you under a Creative Commons Attribution-NonCommercial 4.0 International License the details of which can be found here: https://creativecommons.org/licenses/by-nc/4.0/legalcode
Wilfredo
September 30, 2018 at 6:35 amExcelente work Richard.
I wonder if you could share your .xls for learning.
Richard Maddison
January 1, 2019 at 9:26 pmThanks for your encouragement. I’ll be adding a download page to this site in the next week but in the meantime, you can get the original file from the construction Video from my GitHub account https://github.com/RichardMaddison/Excel-3L-FCNN-Andrew-Ng-s-Circle. This effectively uses the same base model but with 48 dimensions rather than just X & Y position of the dots.
Can you let me know if you’re able to access this? If not I can email it to you.
Best wishes,
Richard